Time: 2:30
Introduction
This year, Title IX is celebrating its 50th anniversary. Since enactment, the number of high school girl athletes has increased from 295,000 in 1972 to more than 2.6 million today! And, it’s also credited with decreasing the dropout rate of girls in high schools and increasing the number of women who pursue higher education and complete college degrees.
To celebrate, FinalForms has created the Equity Dashboard tool to assist with your school’s Title IX requirements.
The Issue
We know your priorities lie in creating an environment for students that includes equal opportunities and equitable sport offerings. But, how is the data you are collecting enabling you to create such an environment?
After speaking with John Appelgate, District Director of Athletics and Activities at Lake Washington School District, he noted the difficulties of viewing data and applying it to Title IX issues. “While our state provides us with forms and questionnaires, our numbers may be okay but female athletes may not have equal facilities."
Therein lies the issue: how can you translate those numbers into creating equitable and equal opportunities for all students?
The Solution
FinalForms Equity feature helps your school collect data more effectively while making said data applicable to your school's Title IX goals.
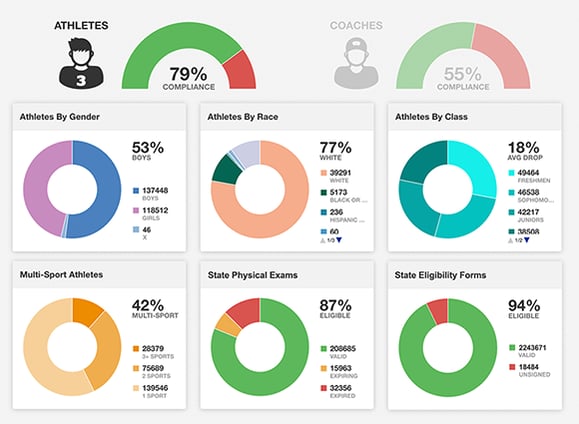
On your school’s Equity FastDash you can view:
- Total Enrollment
- Total Number of Athletes
- Total Number of Teams
- Total Number of Sports offered
- Athletes by Gender
- Athletes by Race
- Athletes by Grade
- Athlete Participation
With these different features comes many options for organizing and viewing data. Want to view a breakdown of athletes by different grade levels? How about viewing athlete participation based on the number of sports and gender? You can do that and more with the Equity feature.

Reporting
With the Equity feature, your school will be able to run reports based on your student data. These reports are broken into TitleIX(Schools), Title IX(Sports), and Title IX(Historical).
Title IX(Schools)
- School Name
- Boy/Girl Enrollment
- Boy/Girl Athletes
- Girl Participation
- Boy Participation
- Total number of students per grade by gender
- Total number of students in athletics by gender.
The School report lets you view your entire enrollment broken into total athletes per gender, participation number by gender and by grade.
Title IX(Sports)
- School
- Sport Name
- Gender
- School Year
- Season
- Category
- Grades
- Female Athletes
- Male Athletes
- Number of Teams.
Our Sports report lets you see a more in depth view of your athletes. This can be helpful when determining athlete participation over different grades or viewing which sports bring out the largest turnout for each gender.
Title IX(Historical)
Why are all these numbers so important? With Title IX(Historical) mode, your school can view and compare data from each year. Having this data available can help your school make sure no groups are being discriminated against or left out.
For example, you look at the race breakdown for girl’s basketball. You find that the team is 65% white, 31% black and 4% asian. In order to create a more inclusive space, your school decides to launch a new winter sport to help increase athlete turnout for asian students.
Conclusion
When it comes to Title IX, it’s all about creating a space where students can feel safe and included across sports and academics. We want to be a part of helping you create such a setting.
Schedule a demo to learn more about how you can utilize the Equity feature!
